Hi! My name is Jacob Bird and I was a conservation science intern at The Mariners’ Museum and Park over the Fall of 2025 and Spring of 2026. I recently graduated from Christopher Newport University (CNU) with a B.S. in Physics and am currently a student at Old Dominion University (ODU) earning my PhD in Experimental Physics. My previous research involved investigating the structure of nucleons in high energy collisions at Jefferson Lab.
The Mariners’ Museum and Park has constructed and developed dataloggers. These are devices that measure the local temperature and humidity. We put dataloggers throughout the Museum to monitor the environmental conditions of different spaces, including object storage spaces and galleries. However, a single location measurement does not accurately describe an entire room. My work has been to investigate how a group of dataloggers can be used to collect data from multiple locations in a room. We then applied statistical methods to analyze the environmental conditions and behavior of the tested room.
What are dataloggers?
A datalogger is a small device that repeatedly measures temperature and humidity. It keeps a digital notebook that checks the room’s conditions every few minutes and writes the results down automatically.
For this project, we built our own dataloggers in-house. Each one runs on a battery and uses a microcontroller to display the current conditions. The components sit inside a small 3D-printed case, and are programmed to record temperature and humidity at regular fifteen minute intervals throughout the day and night.
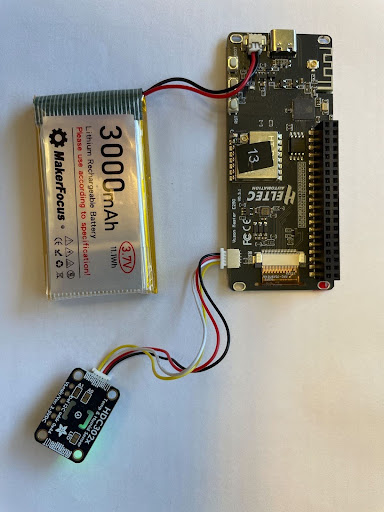
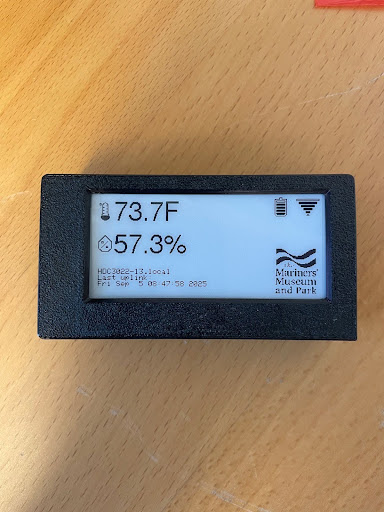
Image of datalogger and what is displayed on the screen. The Mariners’ Museum and Park.
What will we do?
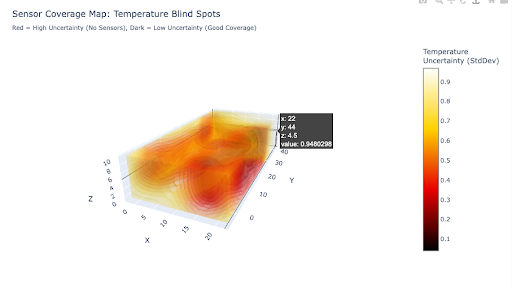
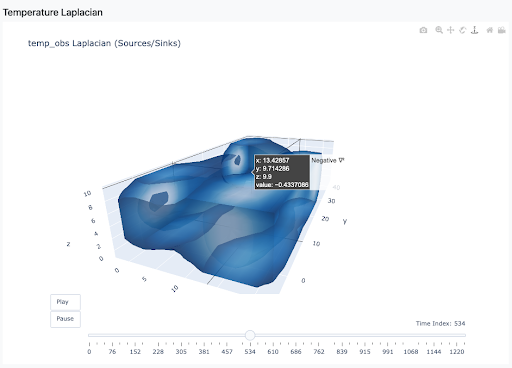
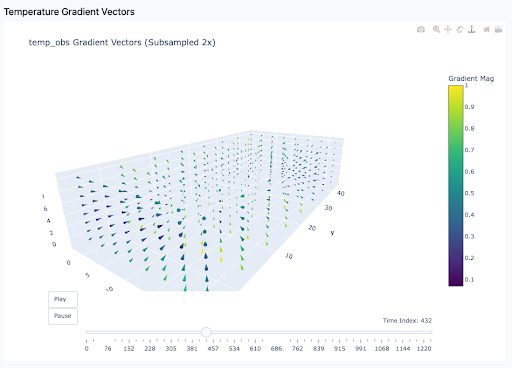
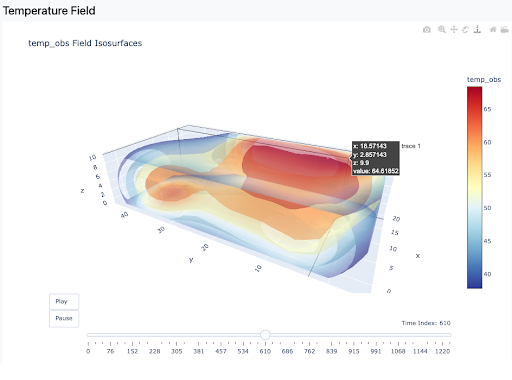
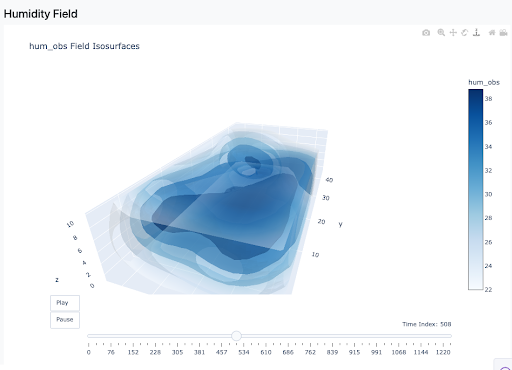
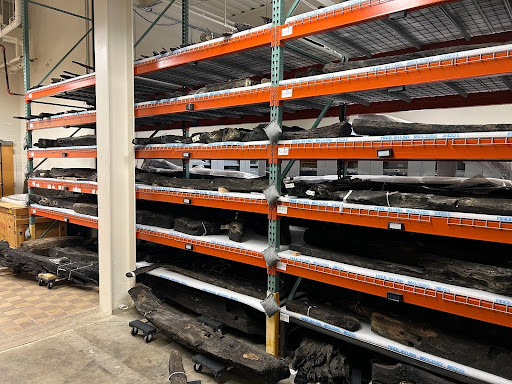
To understand how a storage space behaves, we collected temperature and humidity measurements over time across the entire room, rather than relying on a single sensor. By placing 25 dataloggers throughout a storage space, we were able to build a detailed picture of how conditions varied from place to place and how they changed throughout the day. All of the sensors recorded data at the same time, ensuring that a single snapshot of the room was taken at that moment. This allows us to compare readings directly and look for patterns. With this information, we map out the room, check for any hidden problem areas, and see whether temperature or humidity behaved differently in certain locations. We also examined how conditions changed over time and tested how predictable those changes were in the short term. This approach provides a structured and reliable way to evaluate whether the storage space is being controlled effectively and whether it is truly safe for storage.
What we found
Looking at all of the data together, we learn three main things about the storage space. First, we see the physical properties of the room, such as how temperature and humidity are distributed from place to place. Second, we begin to understand the behavior of the space over time, including how quickly conditions change and whether there are any repeating patterns. Finally, we can predict short-term future conditions, which is important for monitoring and early warnings.
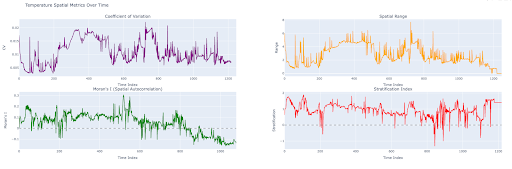
The physical properties of the space were one of the most important things we wanted to understand. By comparing measurements from all 25 dataloggers, we could see whether different parts of the room behaved differently. The results showed that temperature and humidity were extremely consistent throughout the space we tested. There were no isolated hot, cold, damp, or dry pockets that would put artifacts at risk. While slightly warmer air tended to sit higher in the room and cooler air lower down, this separation was smooth and expected, not extreme. Overall, the room behaved exactly like a well-controlled indoor environment should, with conditions clustering tightly across the space.
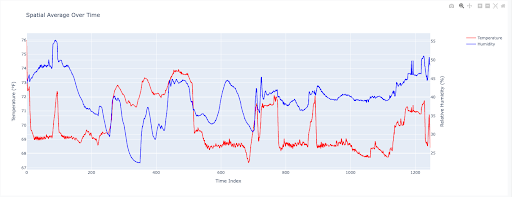
The data also showed that the storage space changes very slowly over time. Over the 13-day experiment, the average temperature stayed around 70°F and the average relative humidity remained near 39%. Rather than sudden jumps or sharp swings, both temperature and humidity drifted gradually. The only noticeable pattern followed the natural cycle of day and night, with no strong or repeating fluctuations beyond that. This slow, steady behavior is ideal for long-term storage and suggests that the environmental controls are working effectively.
Finally, the dataset allowed us to explore how well we could predict conditions in the near future. Using the past measurements, we were able to forecast temperature and humidity with up to 80% accuracy over the short time period of testing. This means that the space behaves in a predictable way, without surprises. Being able to anticipate changes like this is valuable, because it opens the door to early detection if conditions ever begin to drift outside safe ranges.
Results and future work
Taken together, these results show that the storage space is physically stable, behaves smoothly over time, and is predictable in the short term. All three of these findings point to the same conclusion: the environment is well managed and suitable for protecting museum collections.
It is important to note that this experiment captured only a short snapshot of the storage space. Because data was collected over 13 days, the results cannot fully describe the long term behavior of the room. While conditions were stable during this period, it is still possible that larger seasonal changes or slow trends could emerge over months rather than days, potentially creating less ideal conditions for museum collections. Extending this experiment from a two-week collection period to a multi-month collection period would provide a more complete dataset of the room’s long-term behavior.
Future work in this project will include repeating the experiment in other storage areas across the museum to compare conditions and refine analytical techniques. We also plan to improve how we estimate conditions between sensors so that interpolated areas are more accurate. In addition, more advanced modeling approaches like machine learning allow for physical parameters to be introduced and create a method of optimization. Together, these efforts help ensure that museum objects remain protected and create an institutional standard for assessing the health of storage spaces.